
Anesthesia Analytics
Understand your anesthesia operations, quality, and performance.
Explore staffing, OR utilization, first-case starts, turnover, quality measures, and patient feedback in one connected analytics platform. Give clinicians, billing teams, and administrators information they can use to evaluate performance and guide improvement.
For your hospital relationships
Walk into every facility meeting with the numbers.
Utilization, on-time starts, turnover, quality measures, patient satisfaction: benchmarked, trended, and printable. Your group's value to the facility, demonstrated instead of asserted.
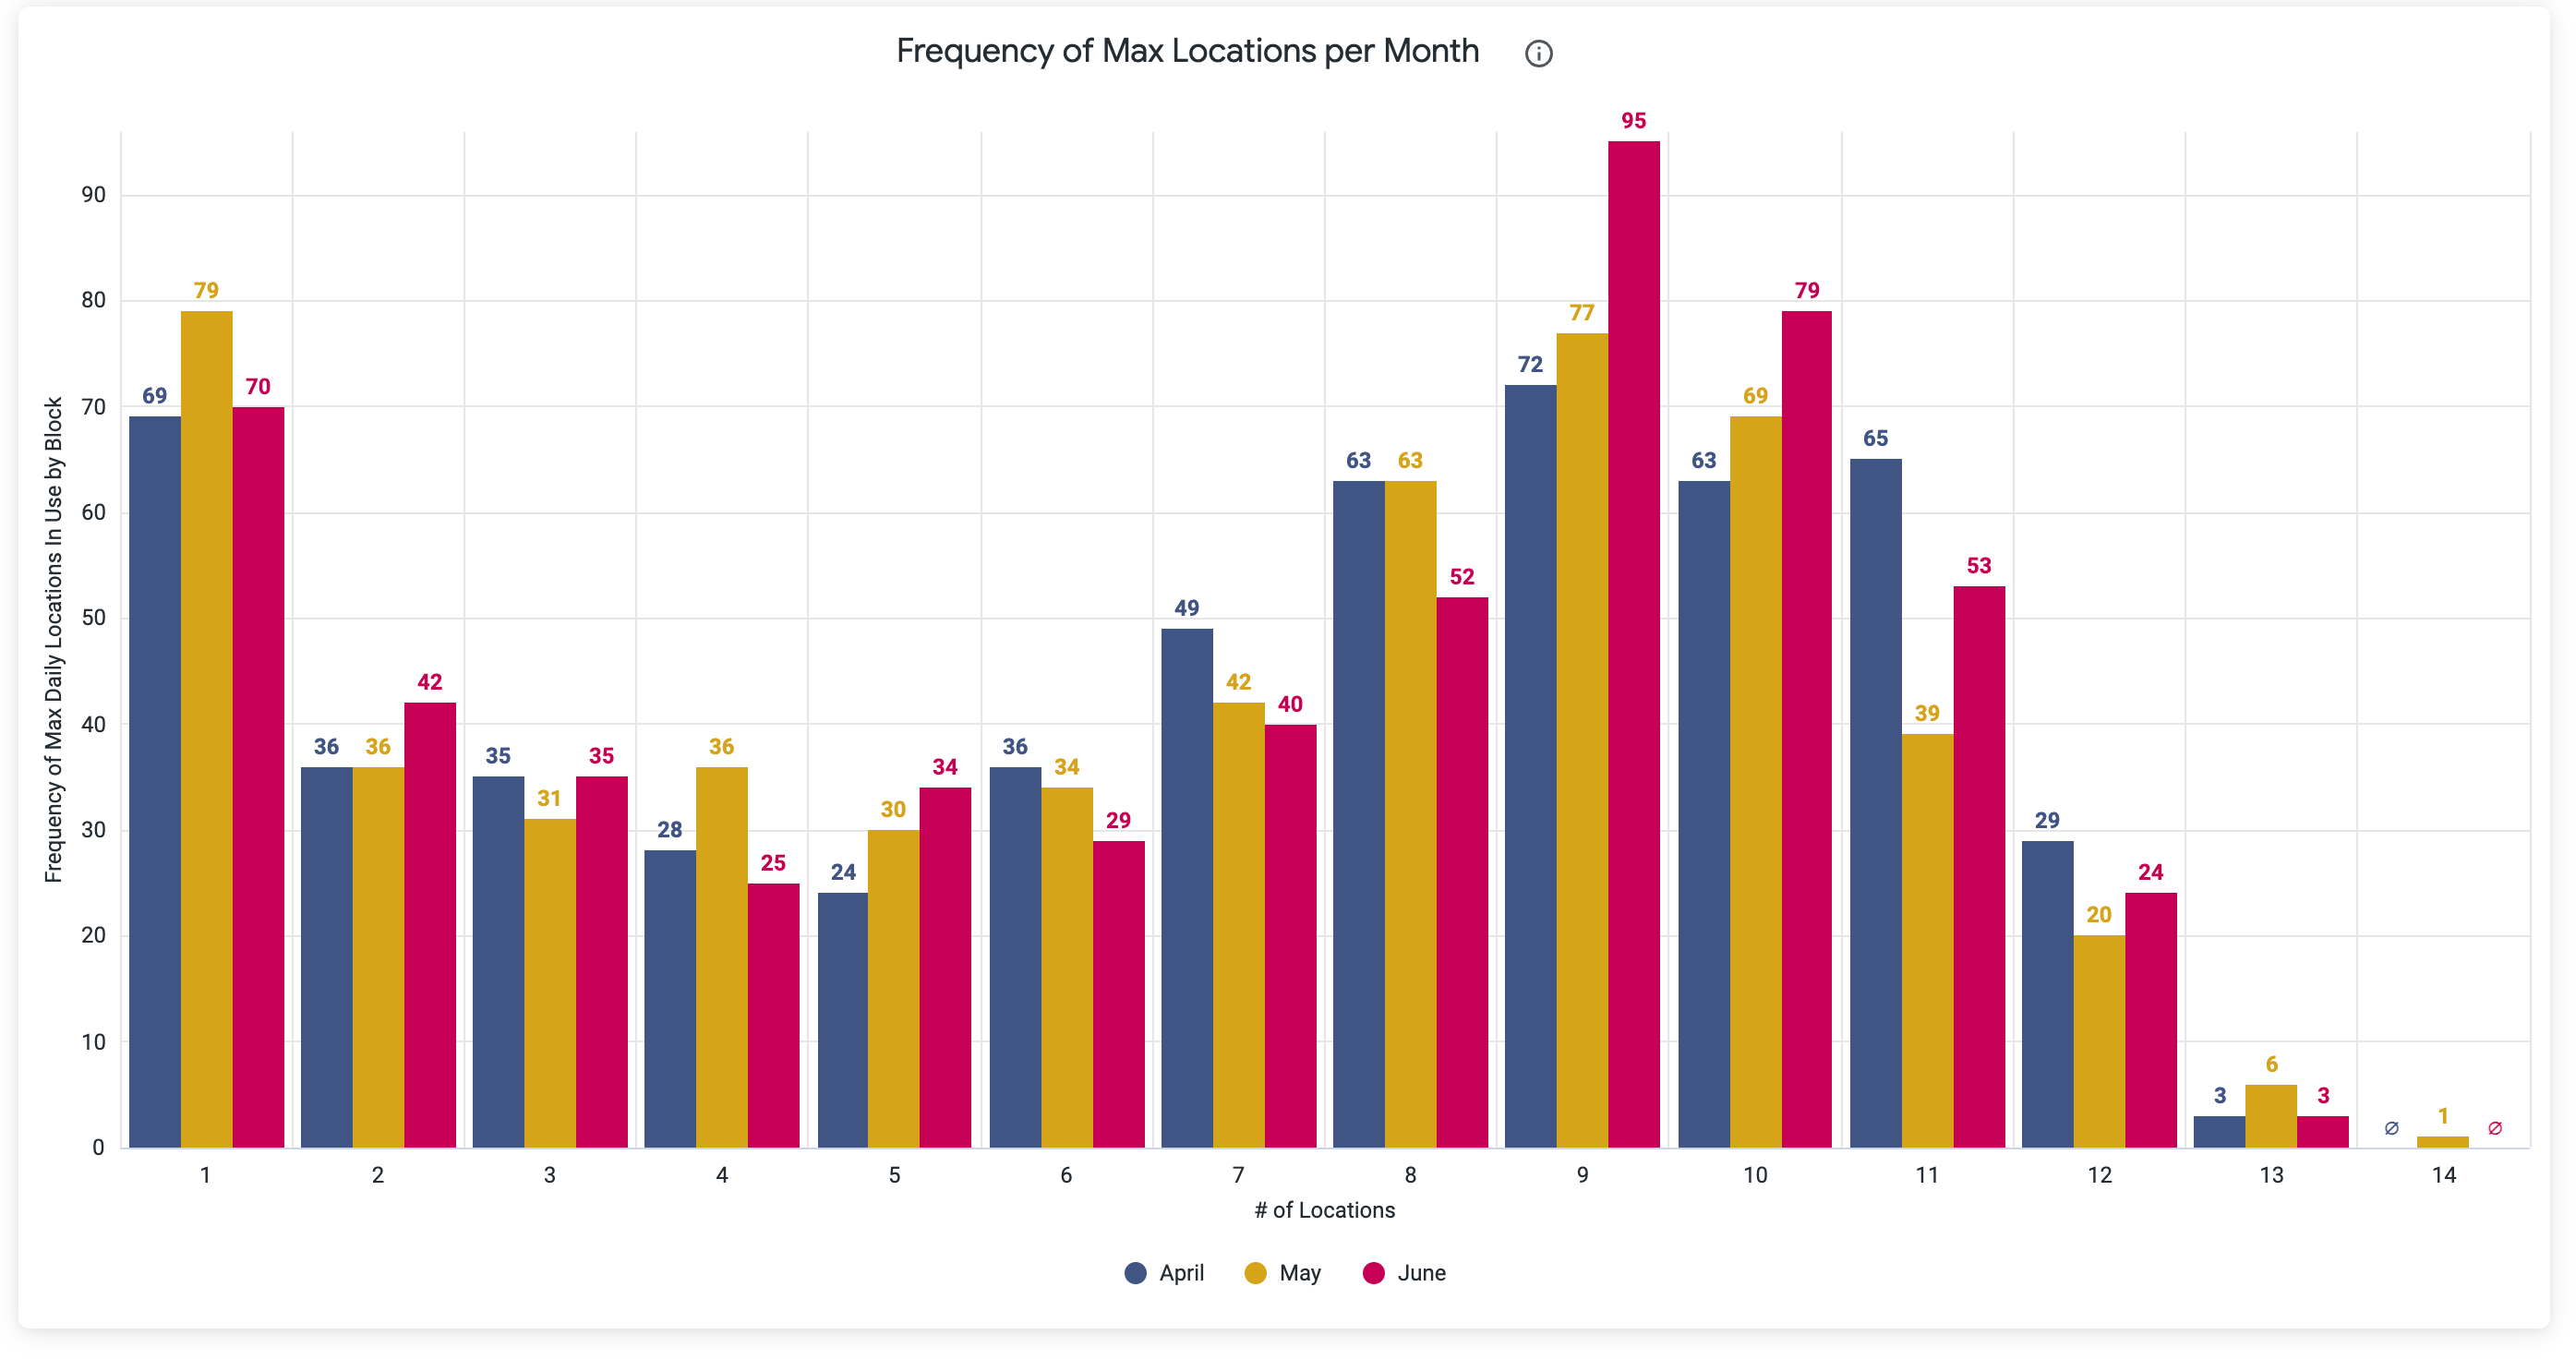
A real example of how groups use it: the CFO wants to staff a 15th anesthetizing location. The utilization heatmap shows you hit 14 simultaneous locations exactly once in the entire quarter, while the efficiency scorecard shows 3,200 minutes lost to surgeon delays. Those reports help your group and the facility evaluate whether additional staffing, schedule changes, or reduced delays would best address the need.
Answer the questions behind your staffing and performance decisions.
- How often are all staffed locations in use?
- What is delaying first-case starts?
- Where does quality performance need closer attention?
The dashboards
Explore a sample of the reports behind the answers.
Dozens of dashboards filter by organization, facility, provider, and date range, and every row links back to the source anesthesia record. These examples show how your team can review daily activity, efficiency, quality, utilization, regional blocks, and facility coverage.
Daily Analytic Email
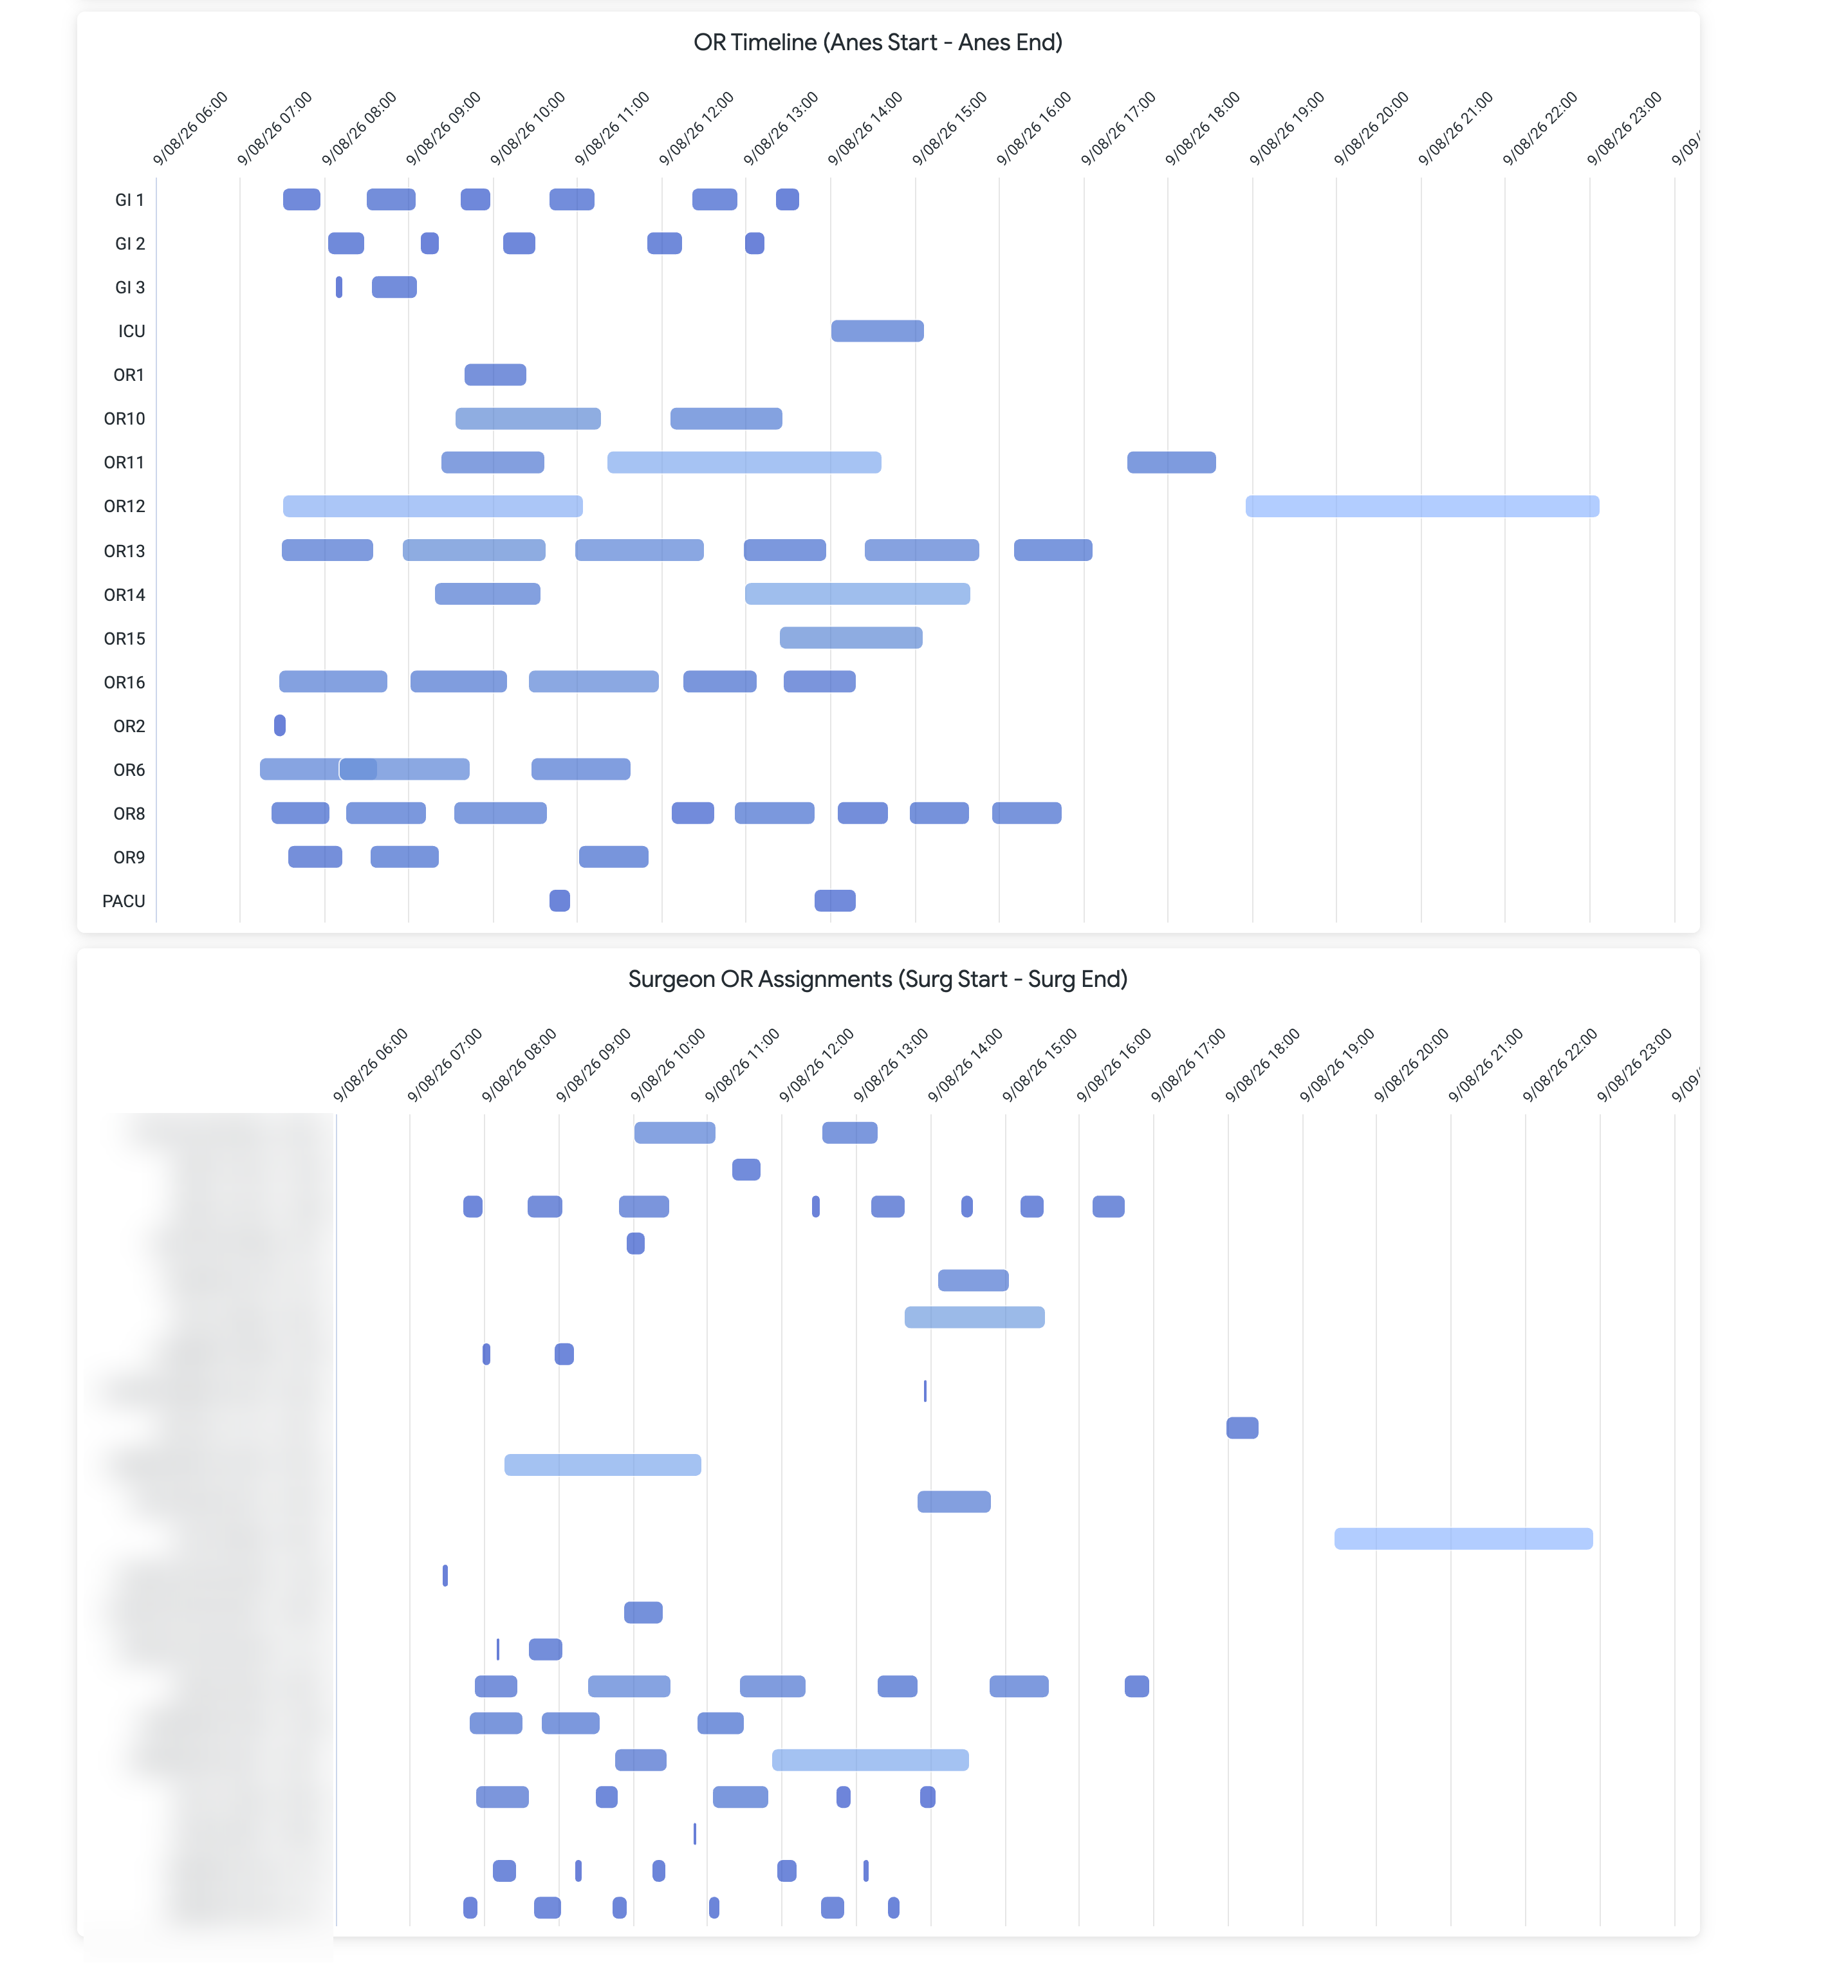
Review the previous day’s documentation completion, anesthesia and surgeon efficiency, OR timelines, and active locations. Follow links into the dashboards for more detail.
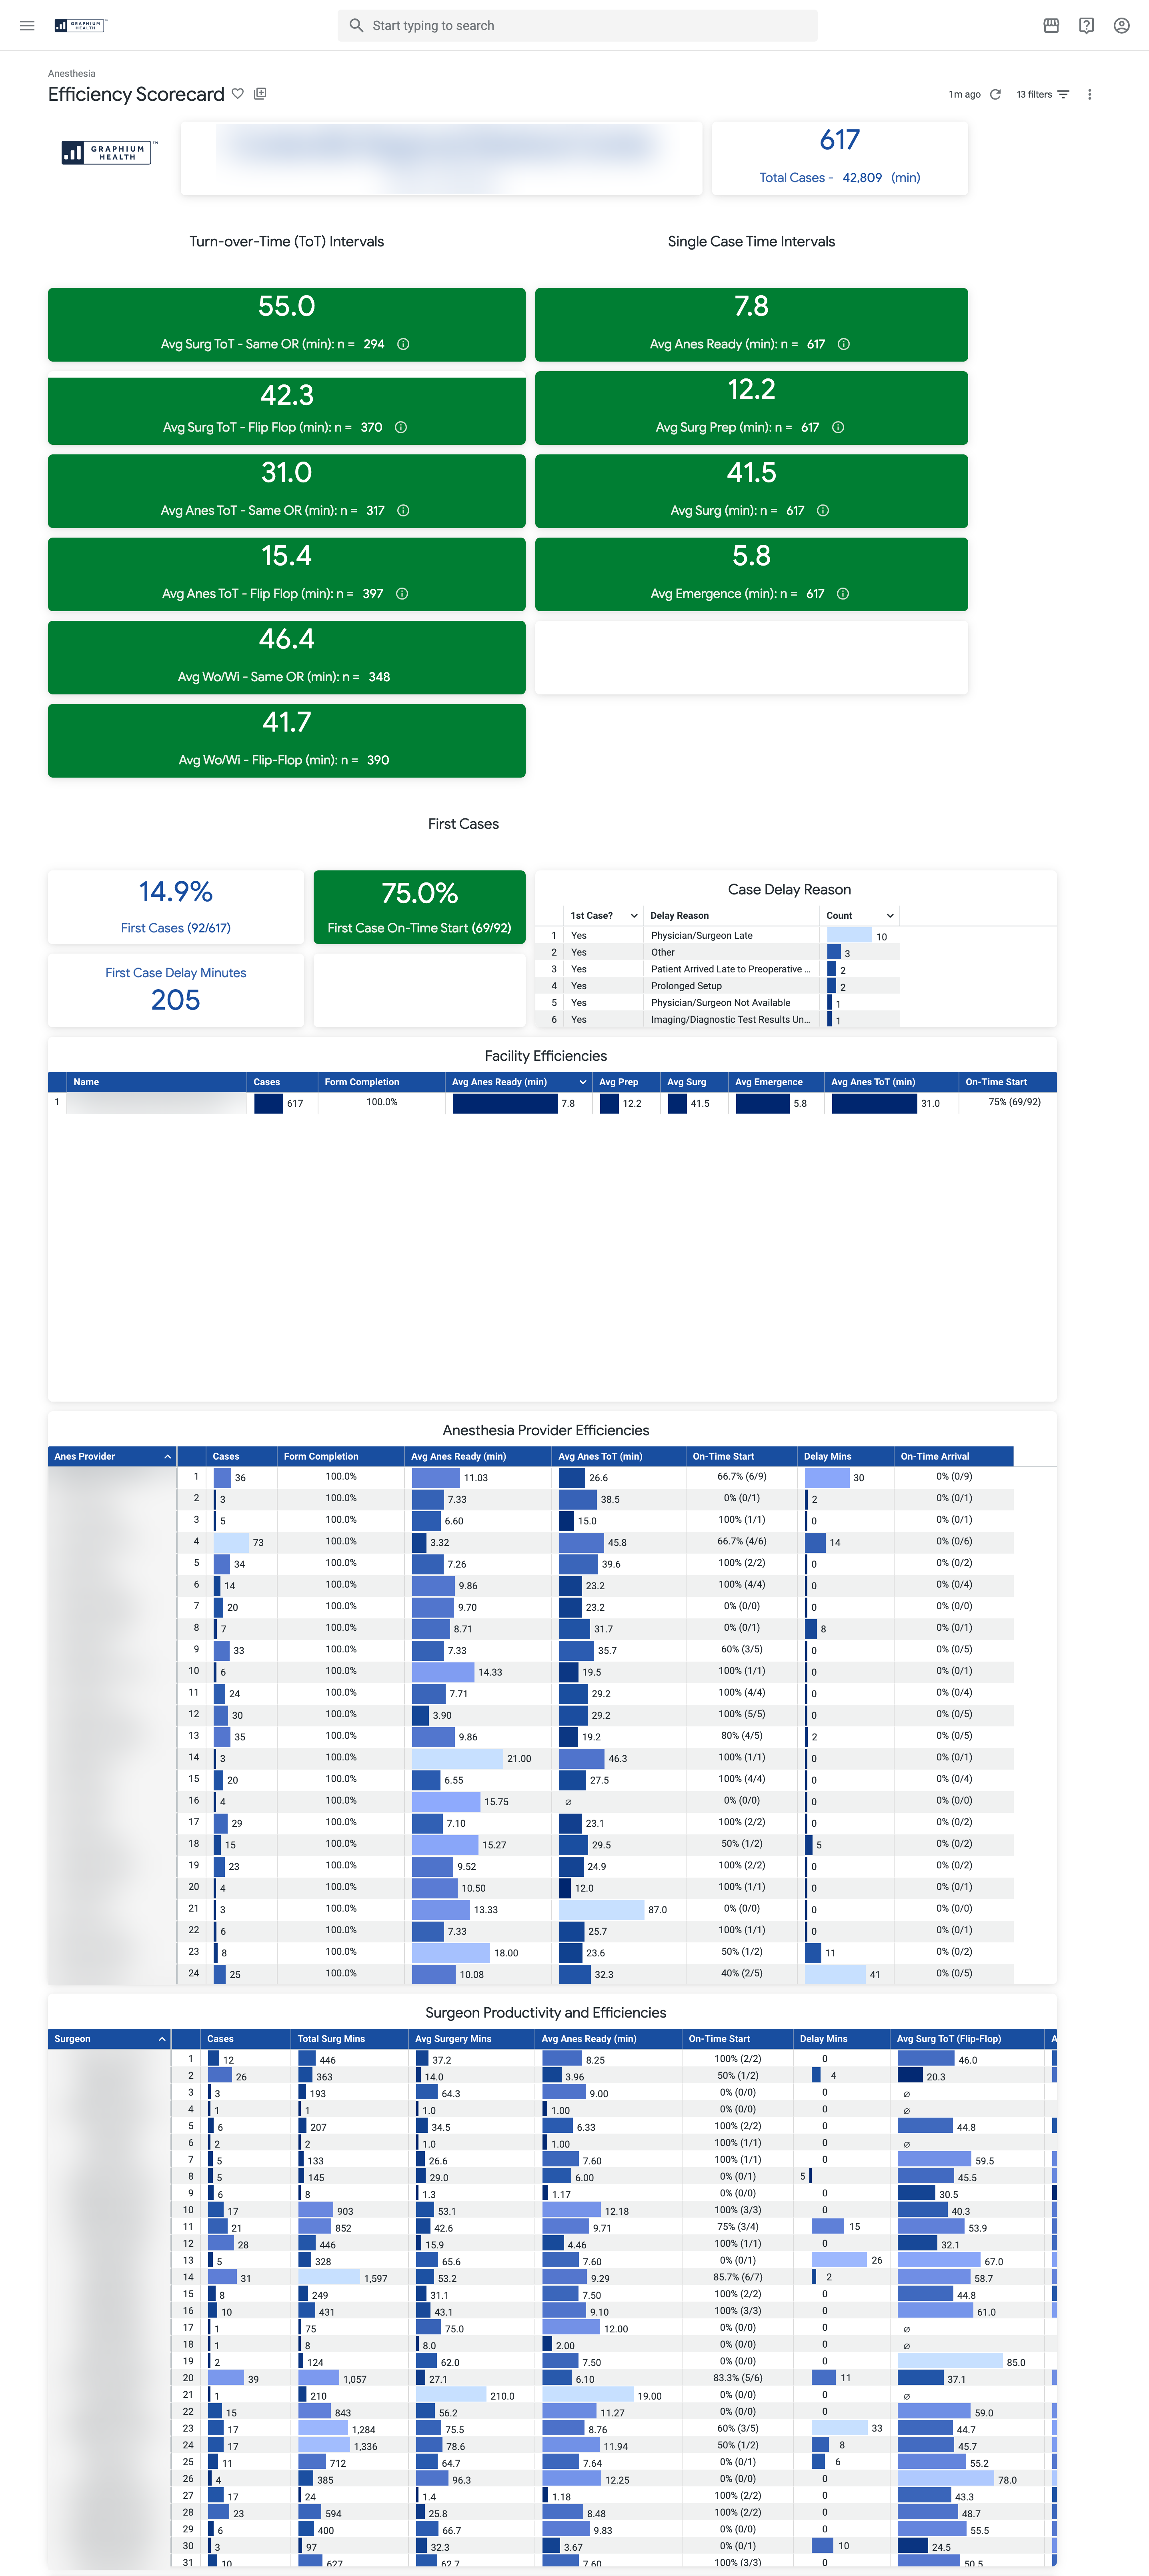
Efficiency Scorecard
Review turnover intervals, first-case on-time starts, delay reasons, anesthesia-ready times, and OR anesthesia hours by facility and provider.
Monthly data
1 of 6 · Monthly overview
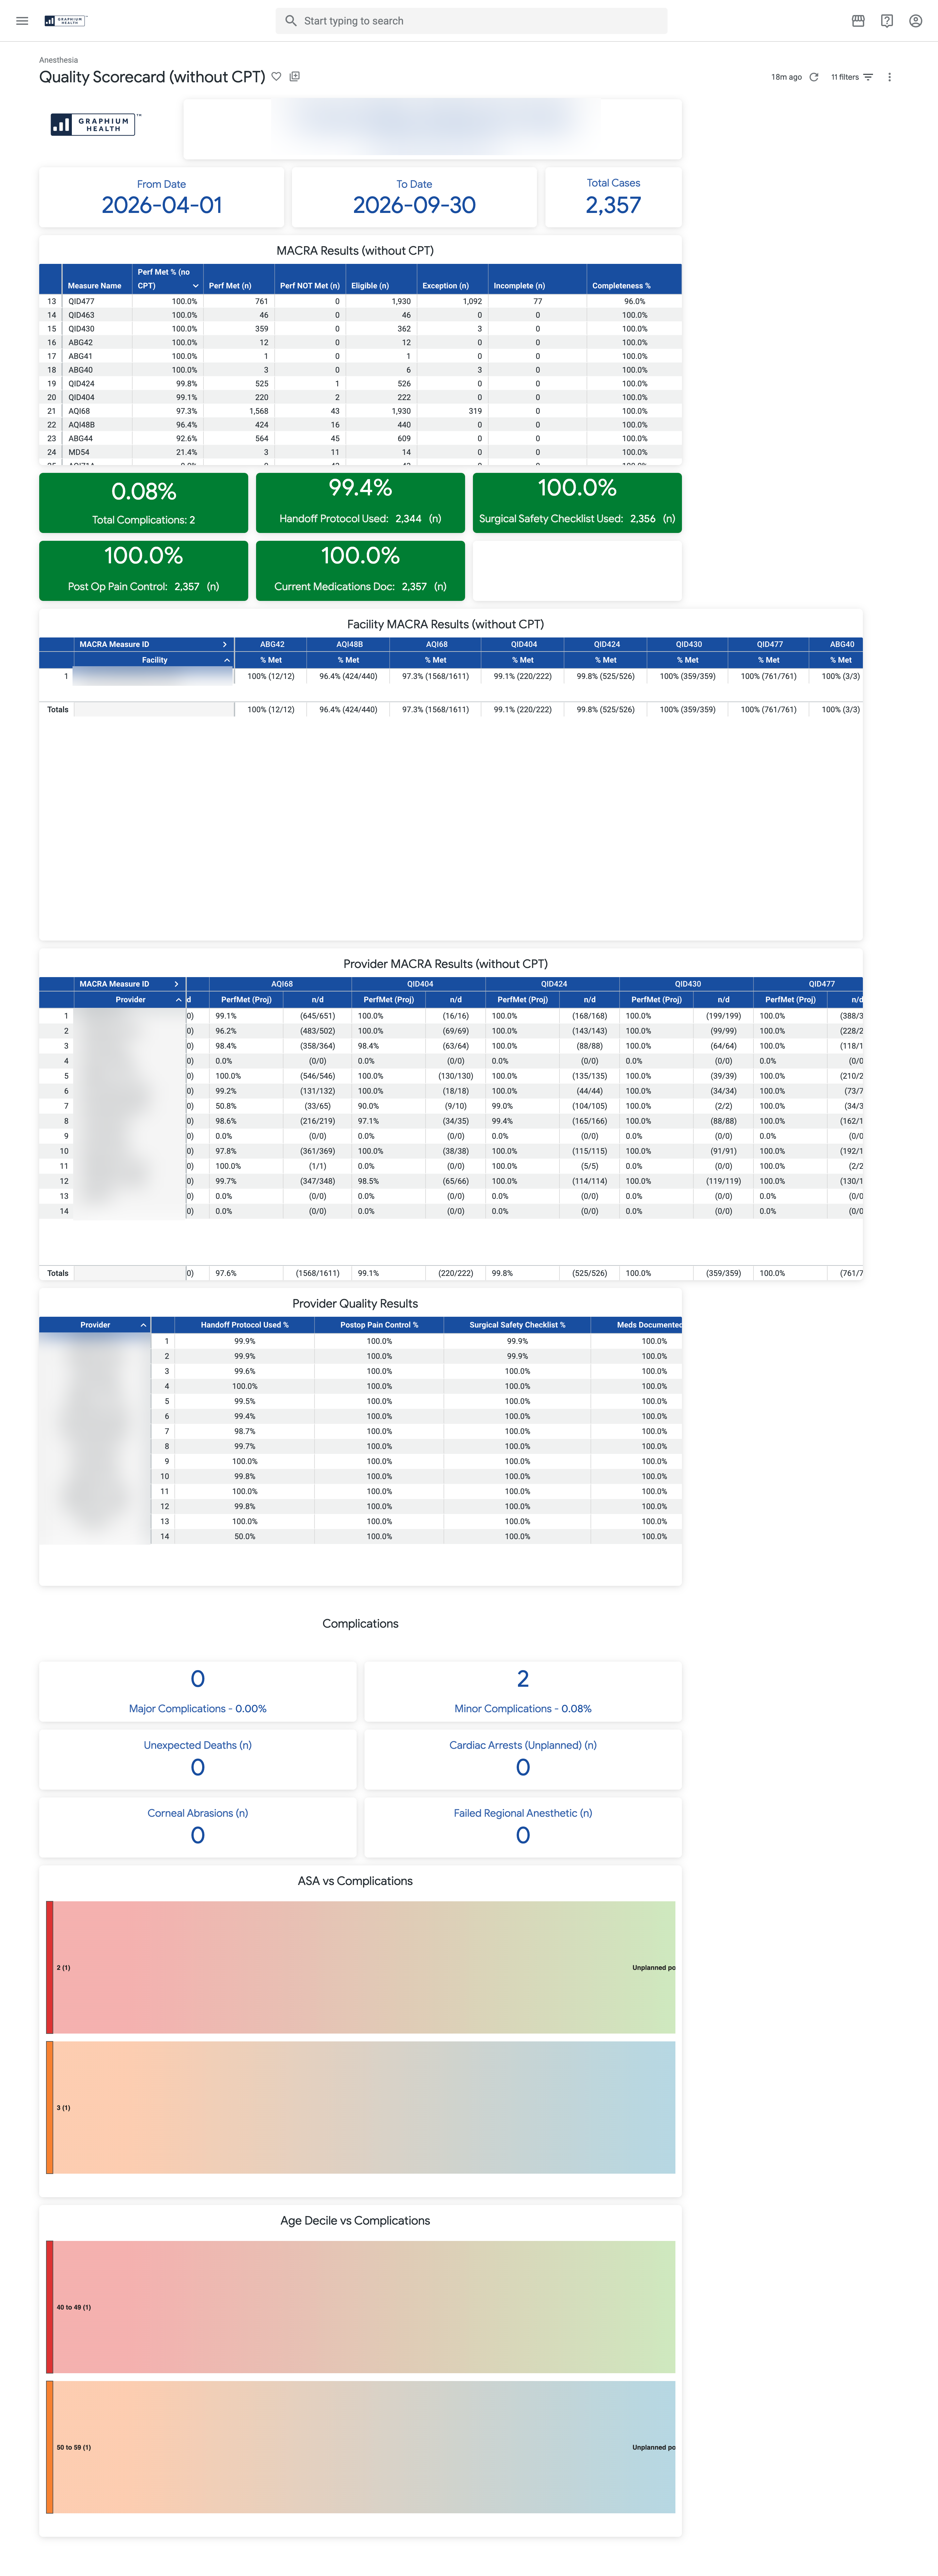
Quality Scorecard
Track eligible cases, measure performance, and data completeness throughout the reporting year. Review complications, handoffs, and checklist documentation alongside the measures reported through Graphium QCDR.
1 of 4 · Measure results
Utilization Heatmap
See when anesthetizing locations are in use, in 30-minute intervals. Use utilization patterns to support staffing and coverage discussions.
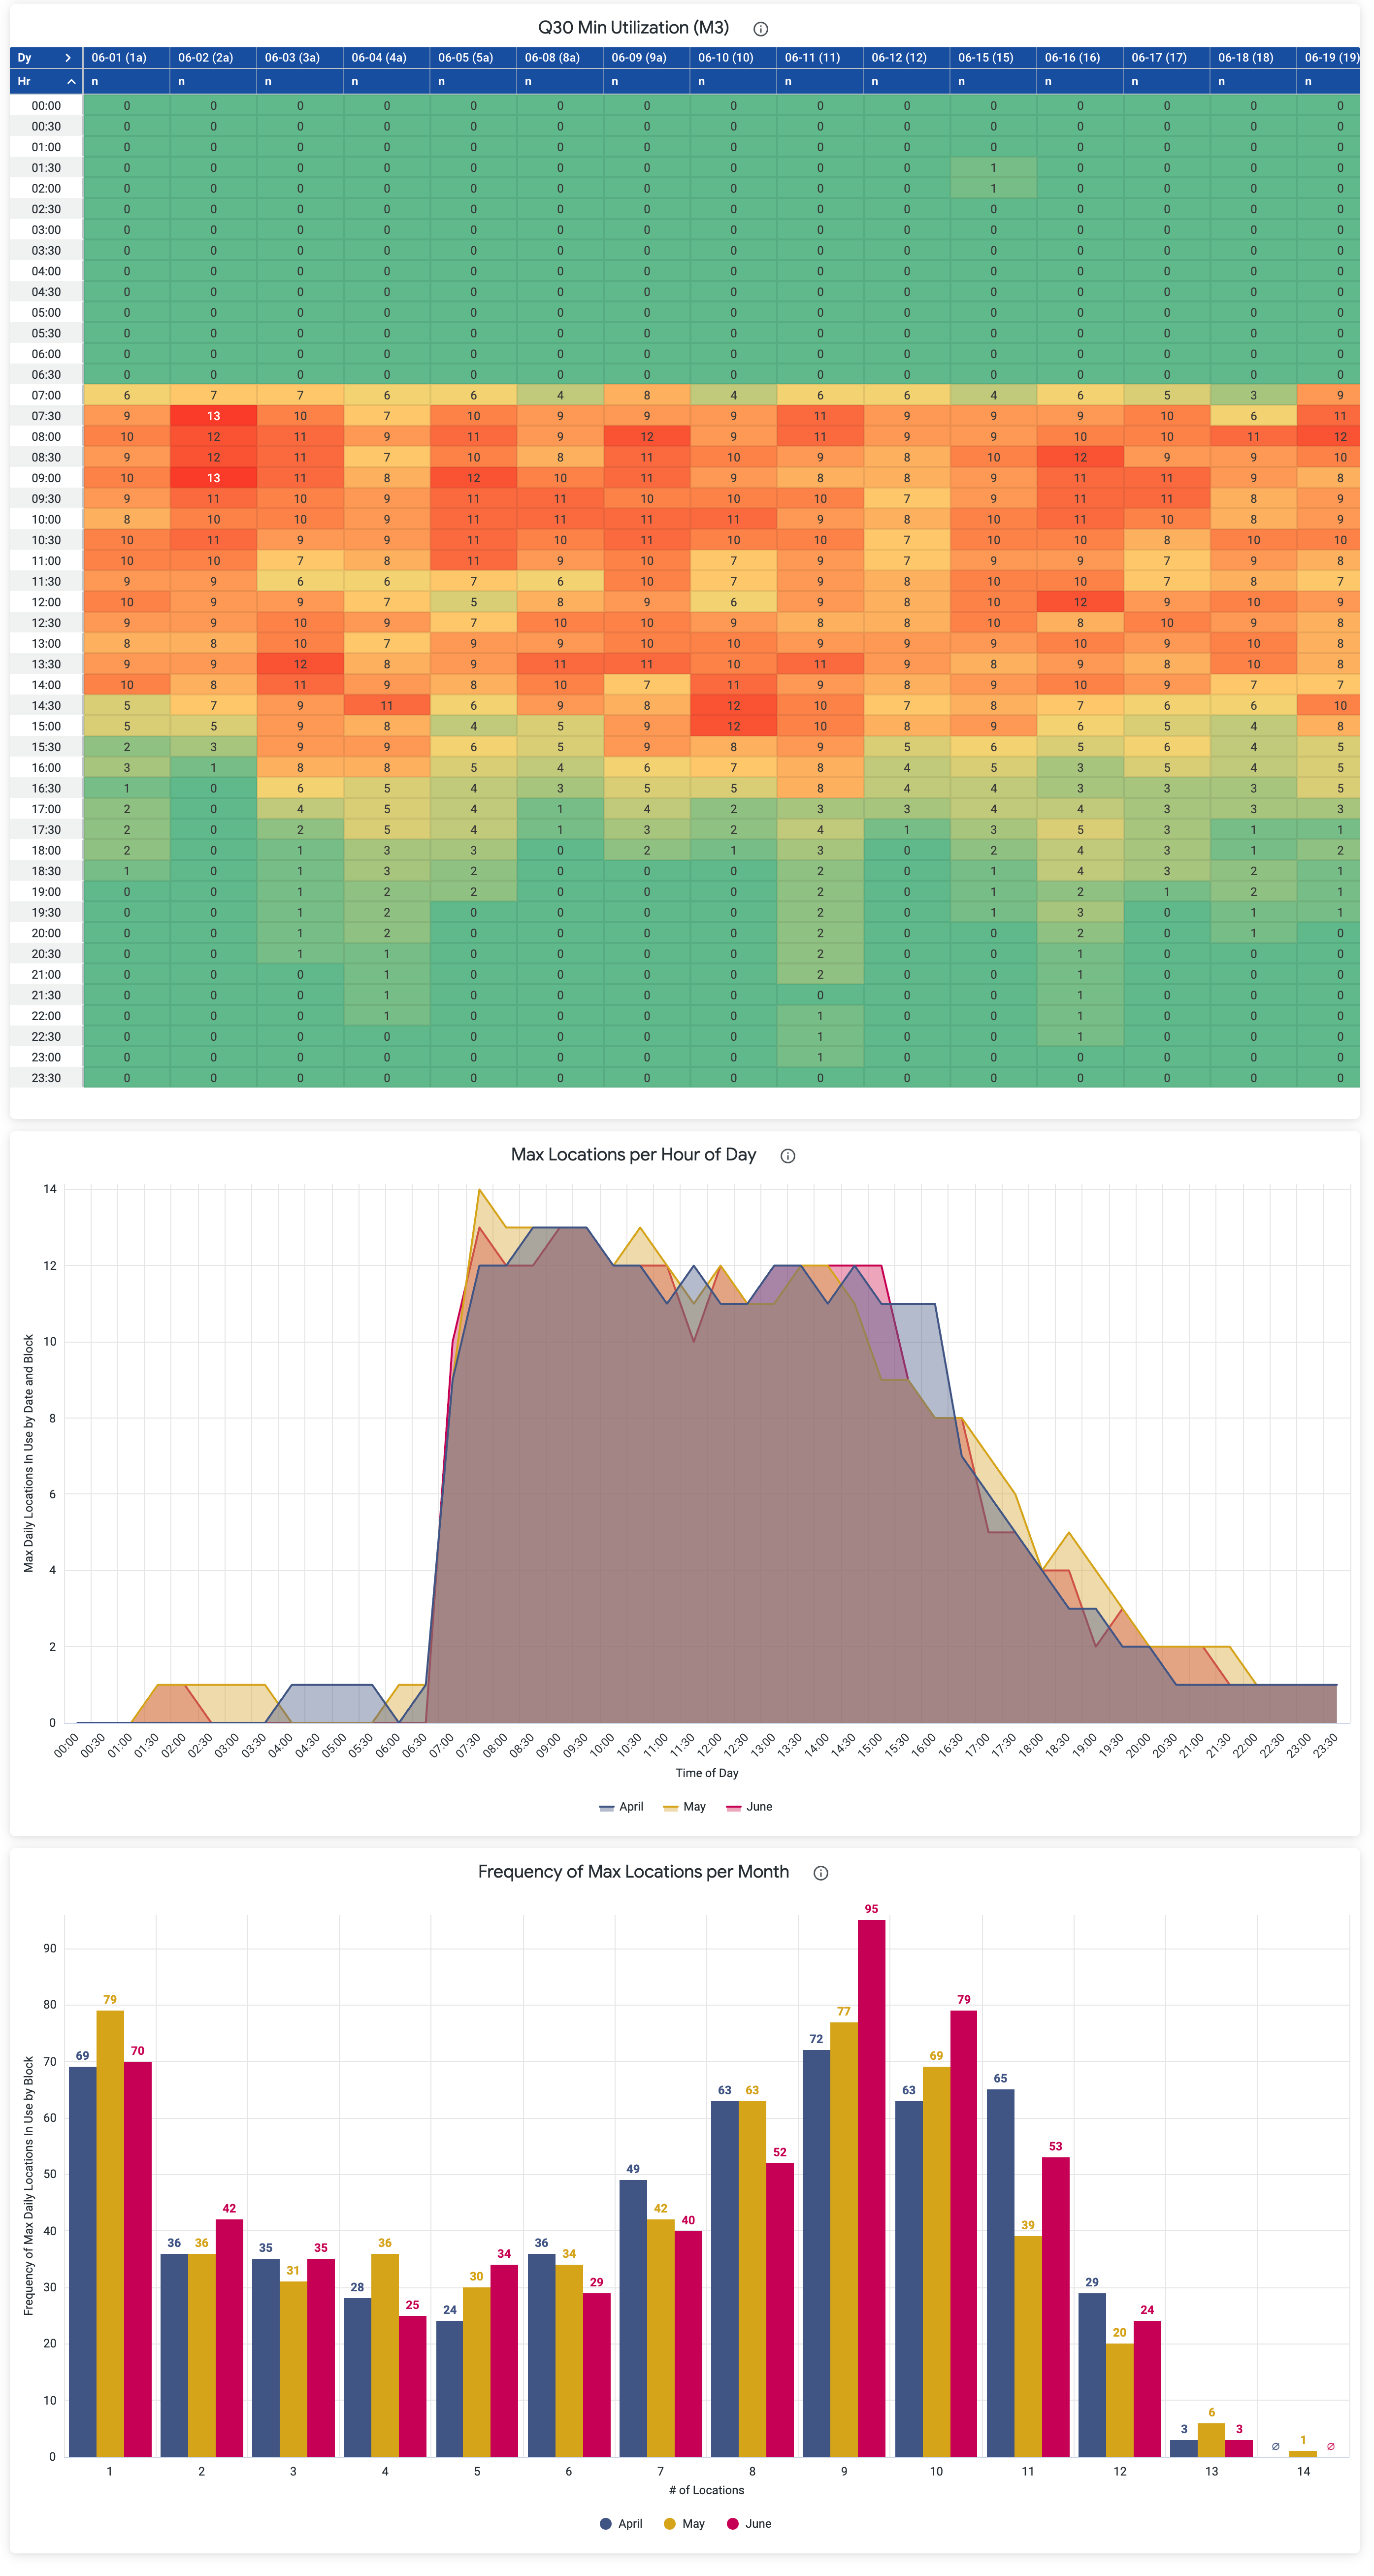
1 of 3 · M3 heatmap
Regional Block Scorecard
Review regional block volumes, techniques, trends, and outcomes by provider and facility.

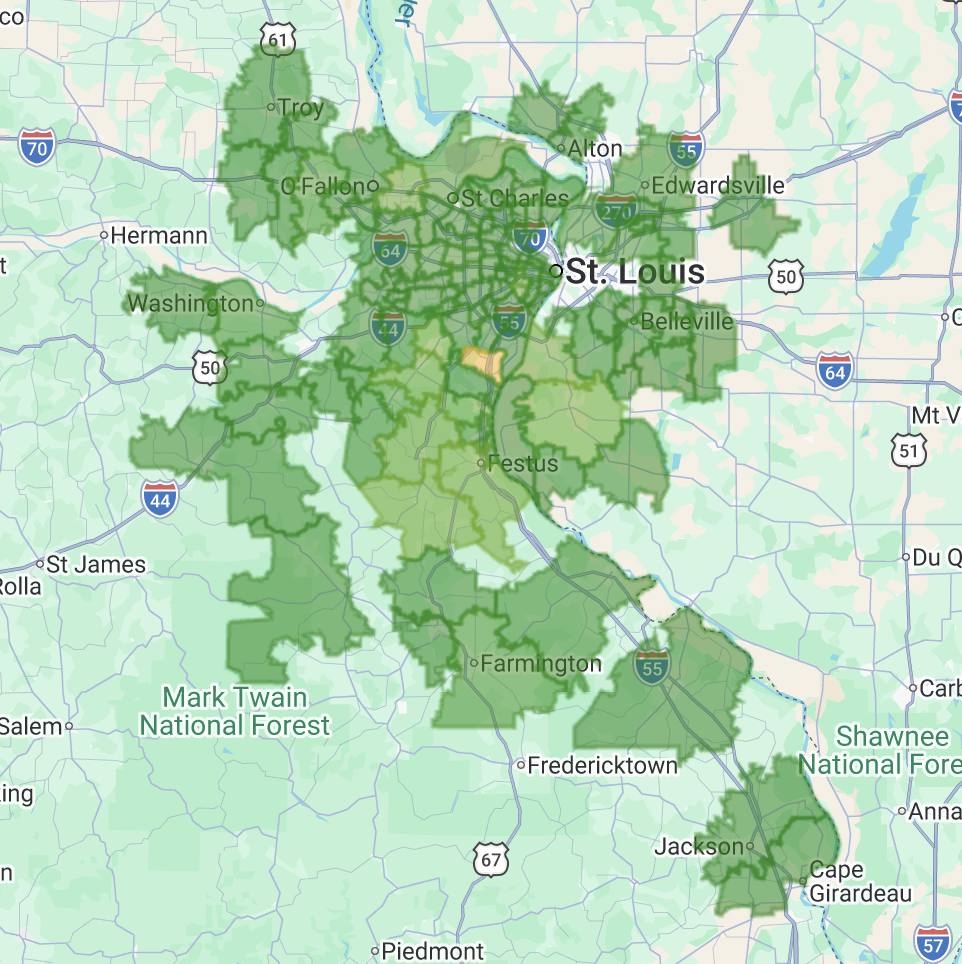
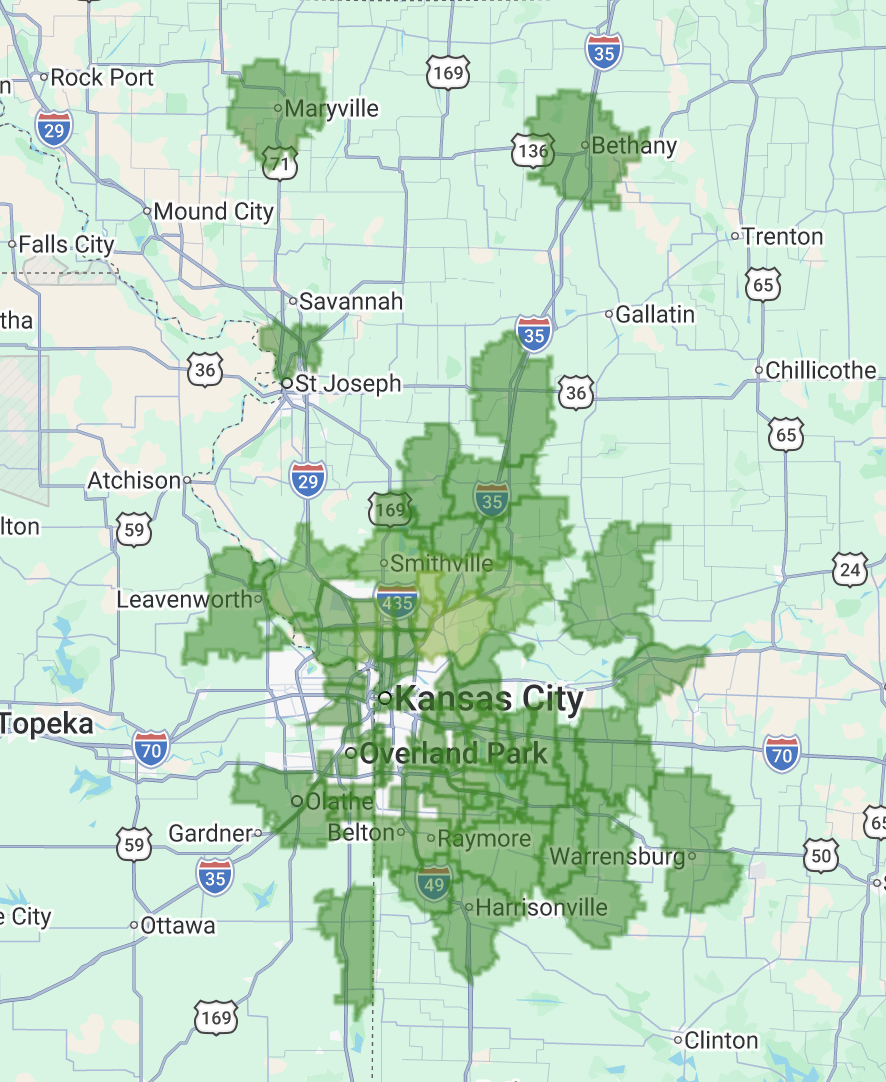
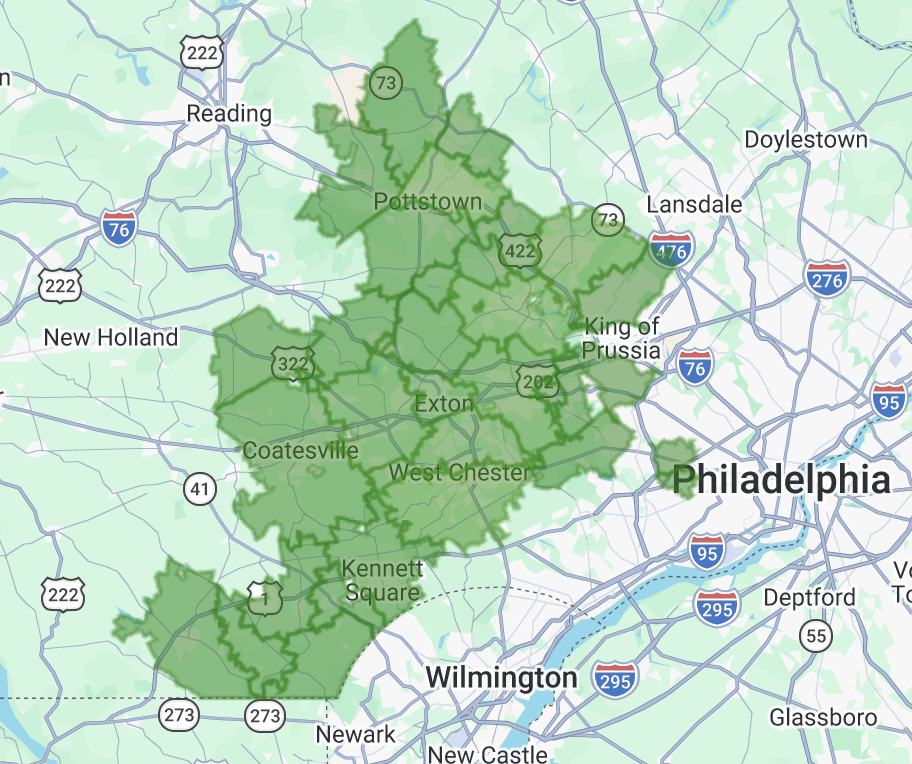
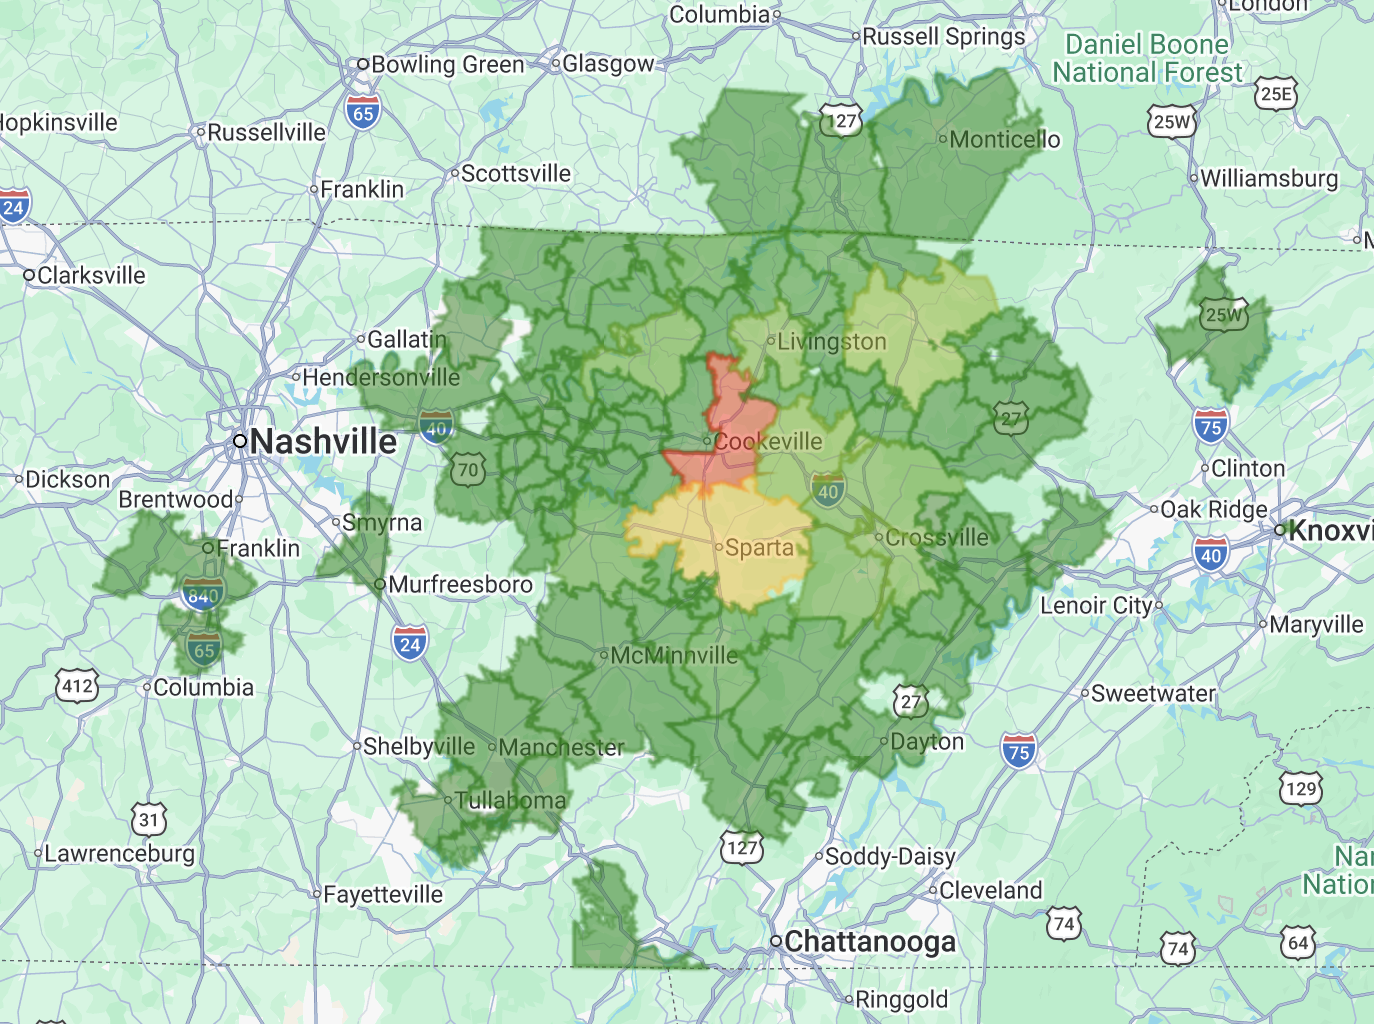
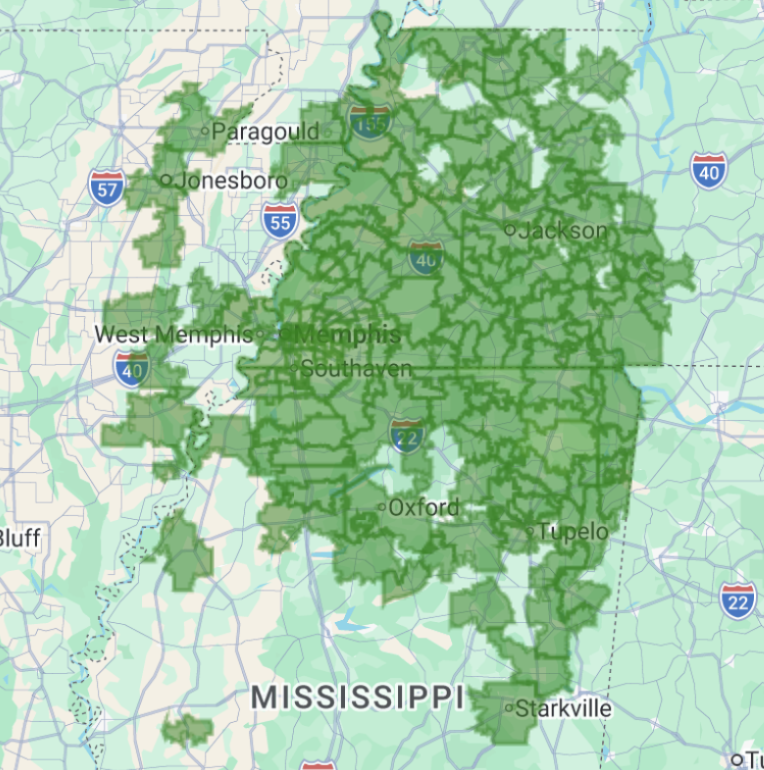
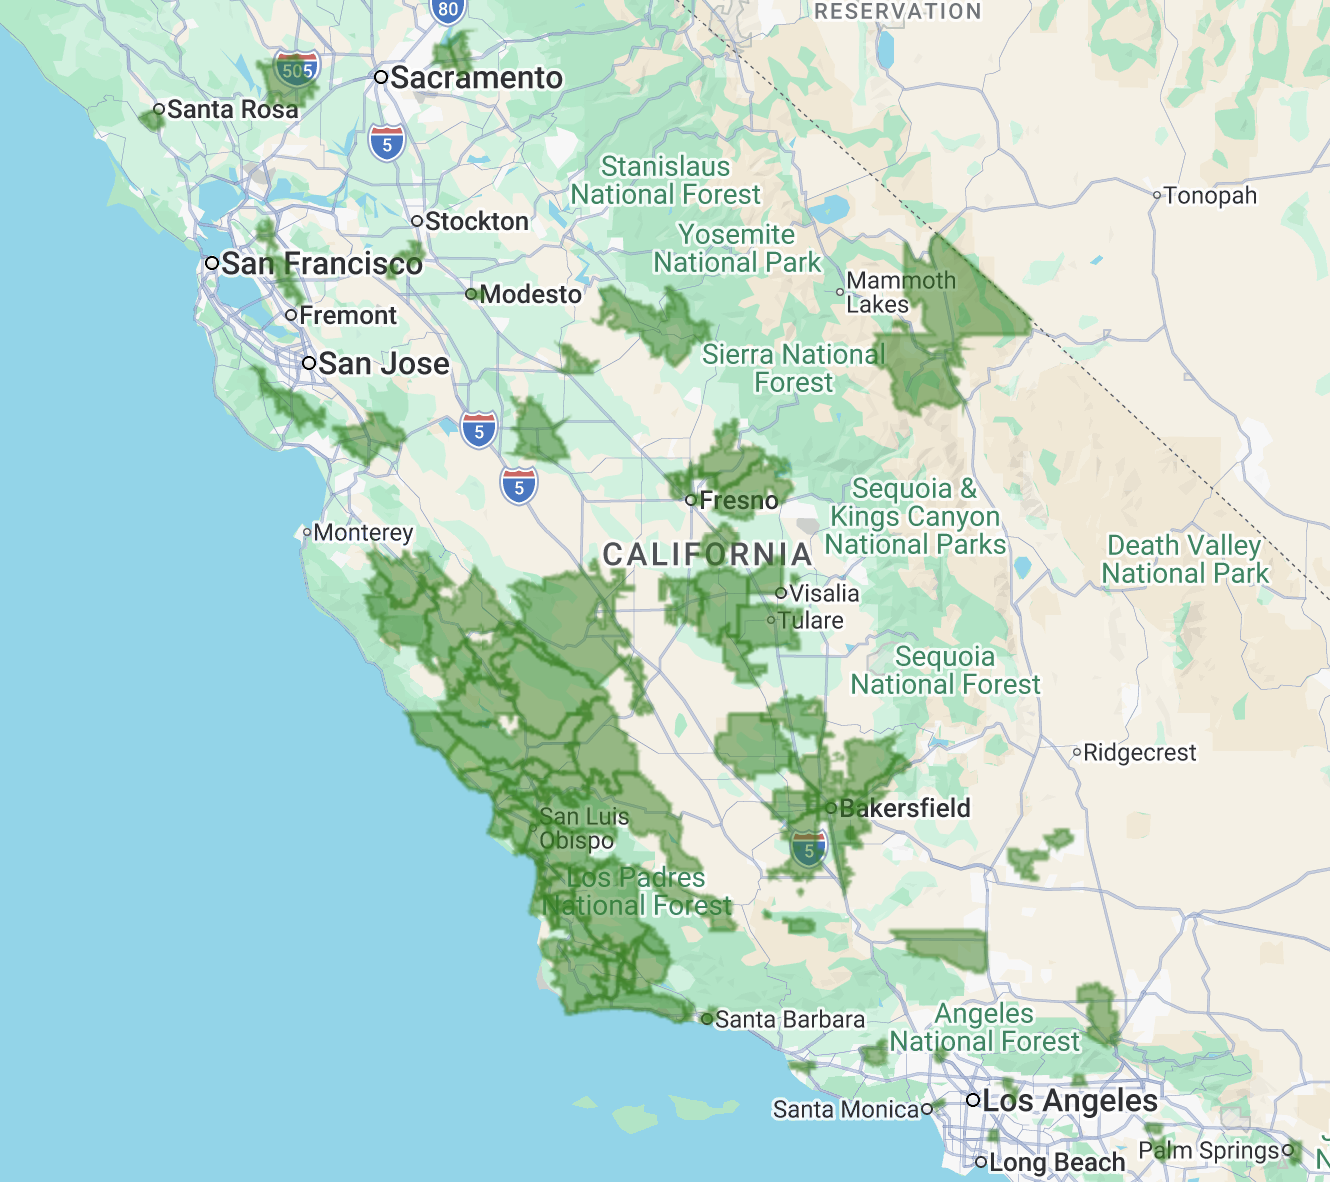
Service Map
View your facilities, anesthetizing locations, case volumes, and coverage together.
1 of 6 · Map 1
Day one
Built-in reports, powered by your documentation.
AnesthesiaEMR and Charge Capture collect information in the same Graphium data model. That information powers anesthesia-specific dashboards without a separate reporting worksheet.
Available reports reflect the information your team captures. Case times support efficiency reporting, location data supports utilization analysis, and regional block documentation supports block reporting.
Use the included dashboards or build additional reports around your organization’s questions.
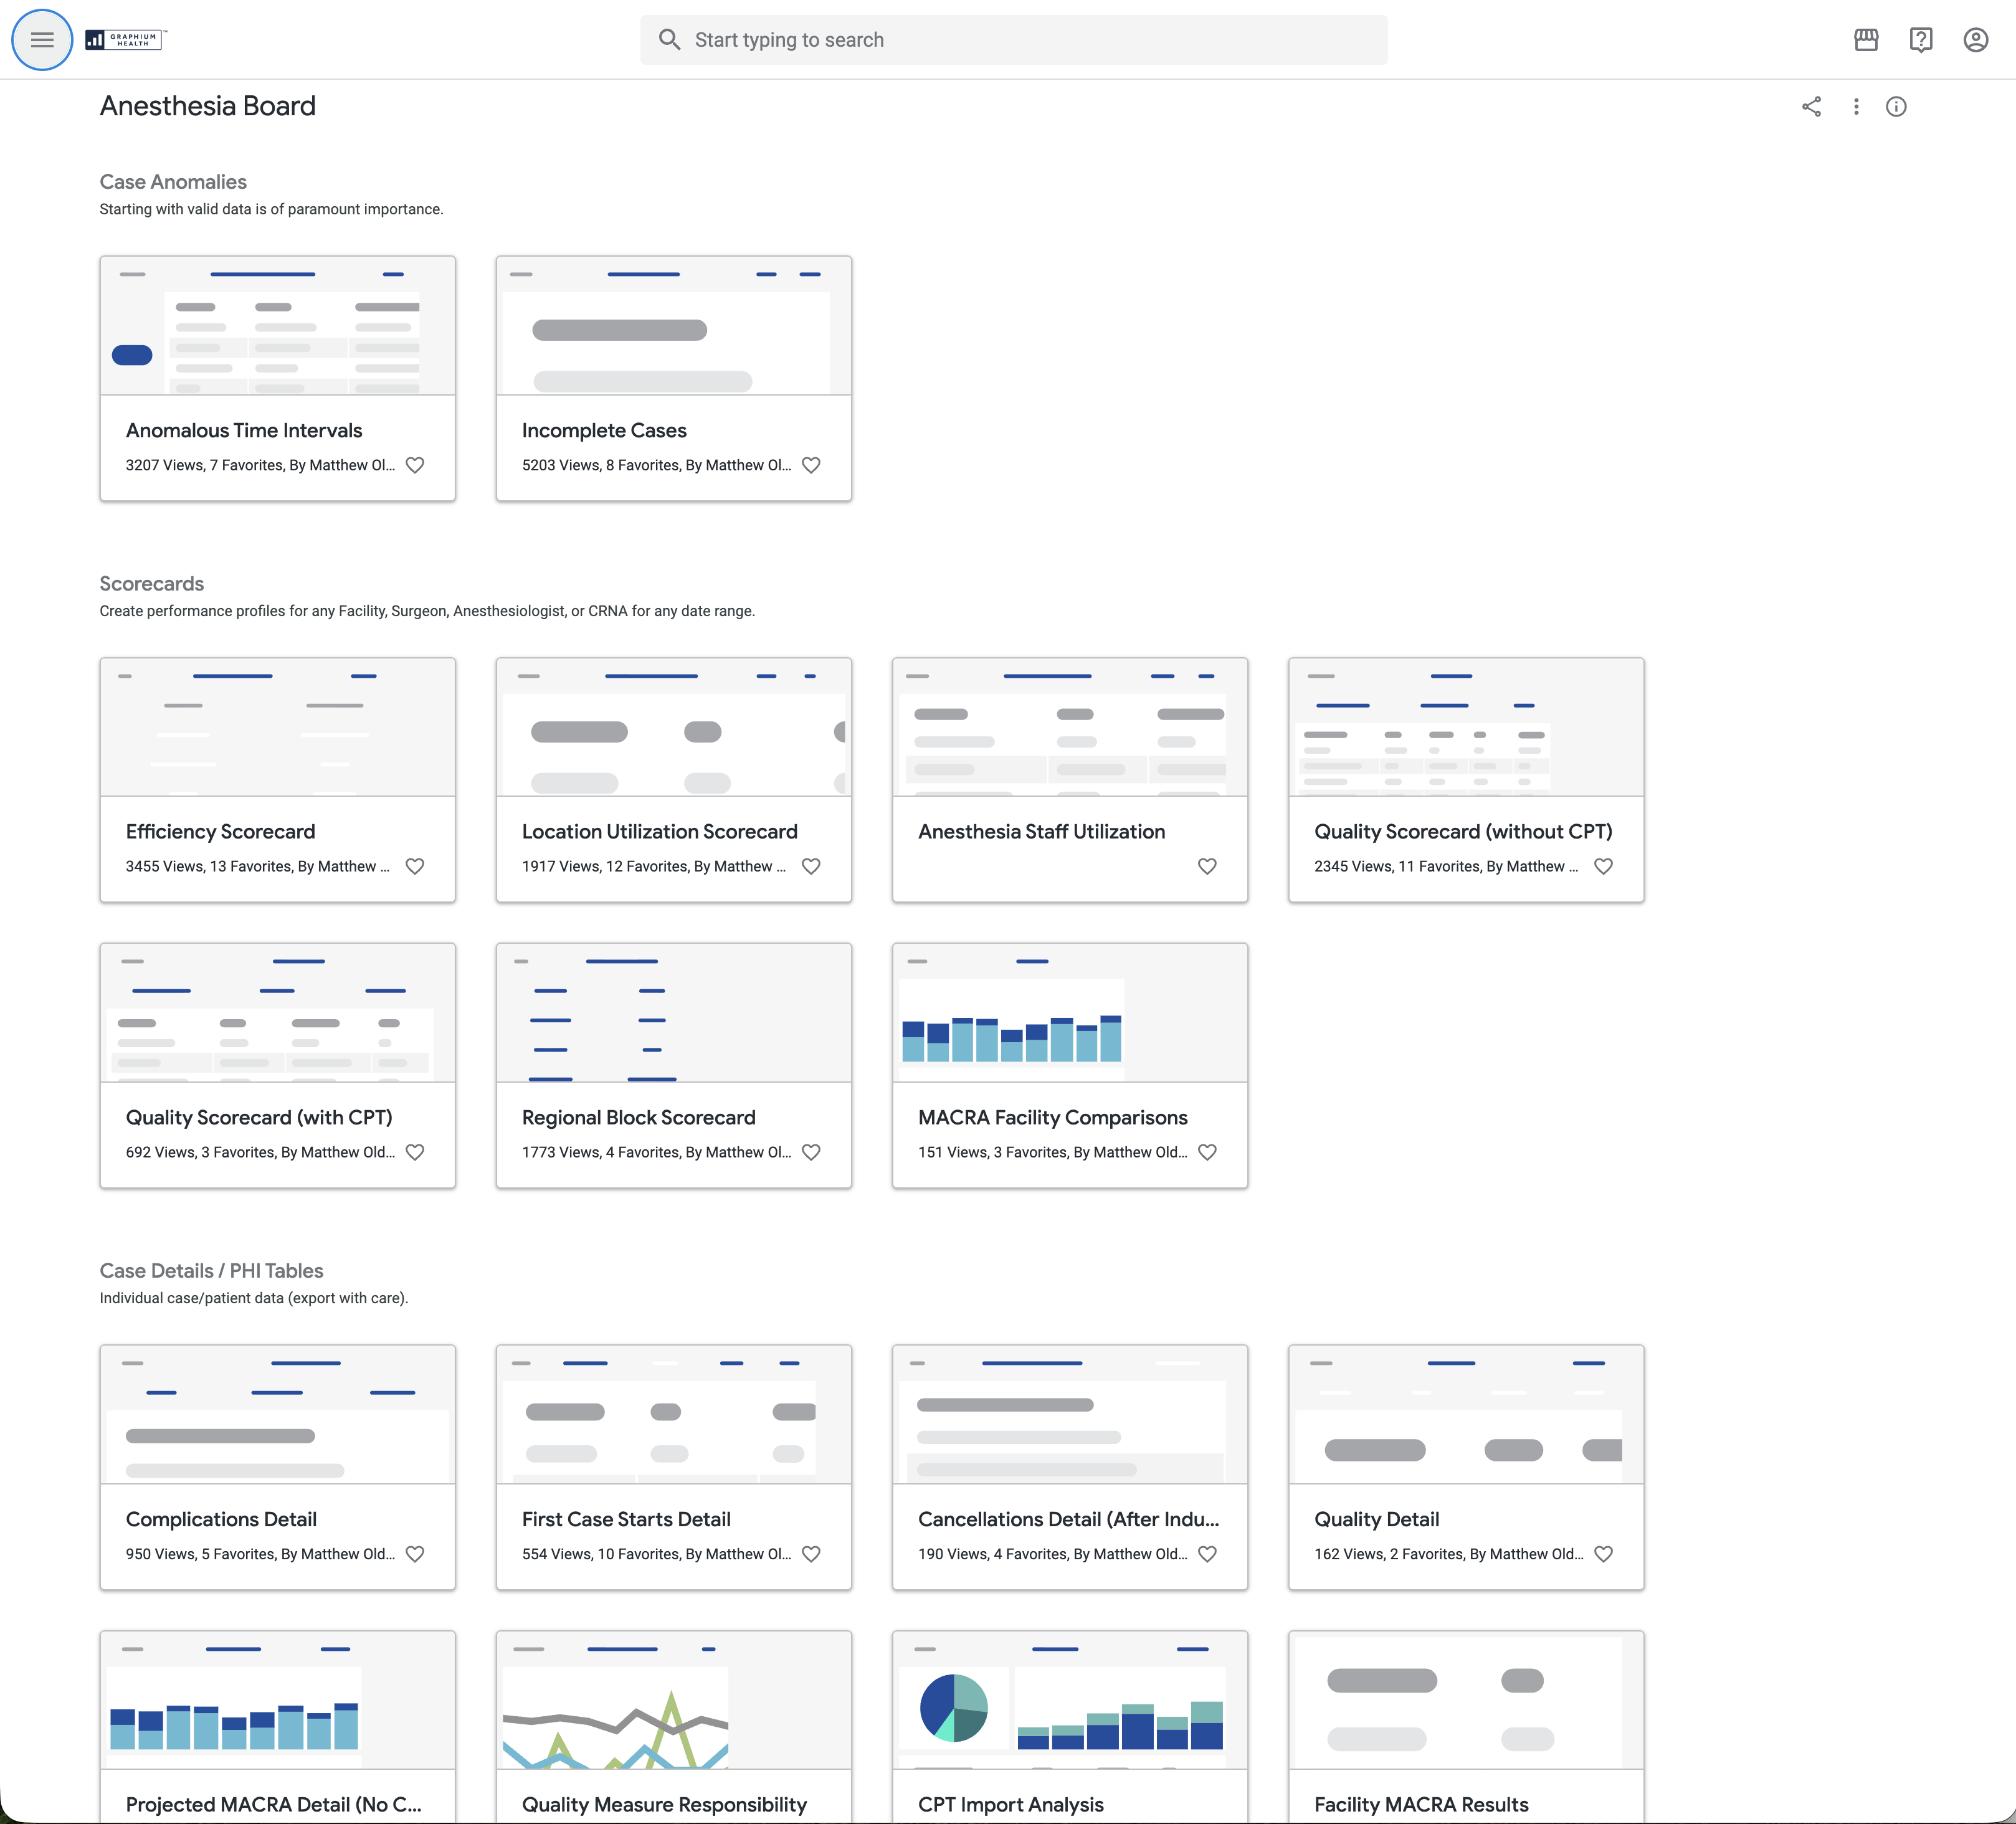
Explore custom reporting
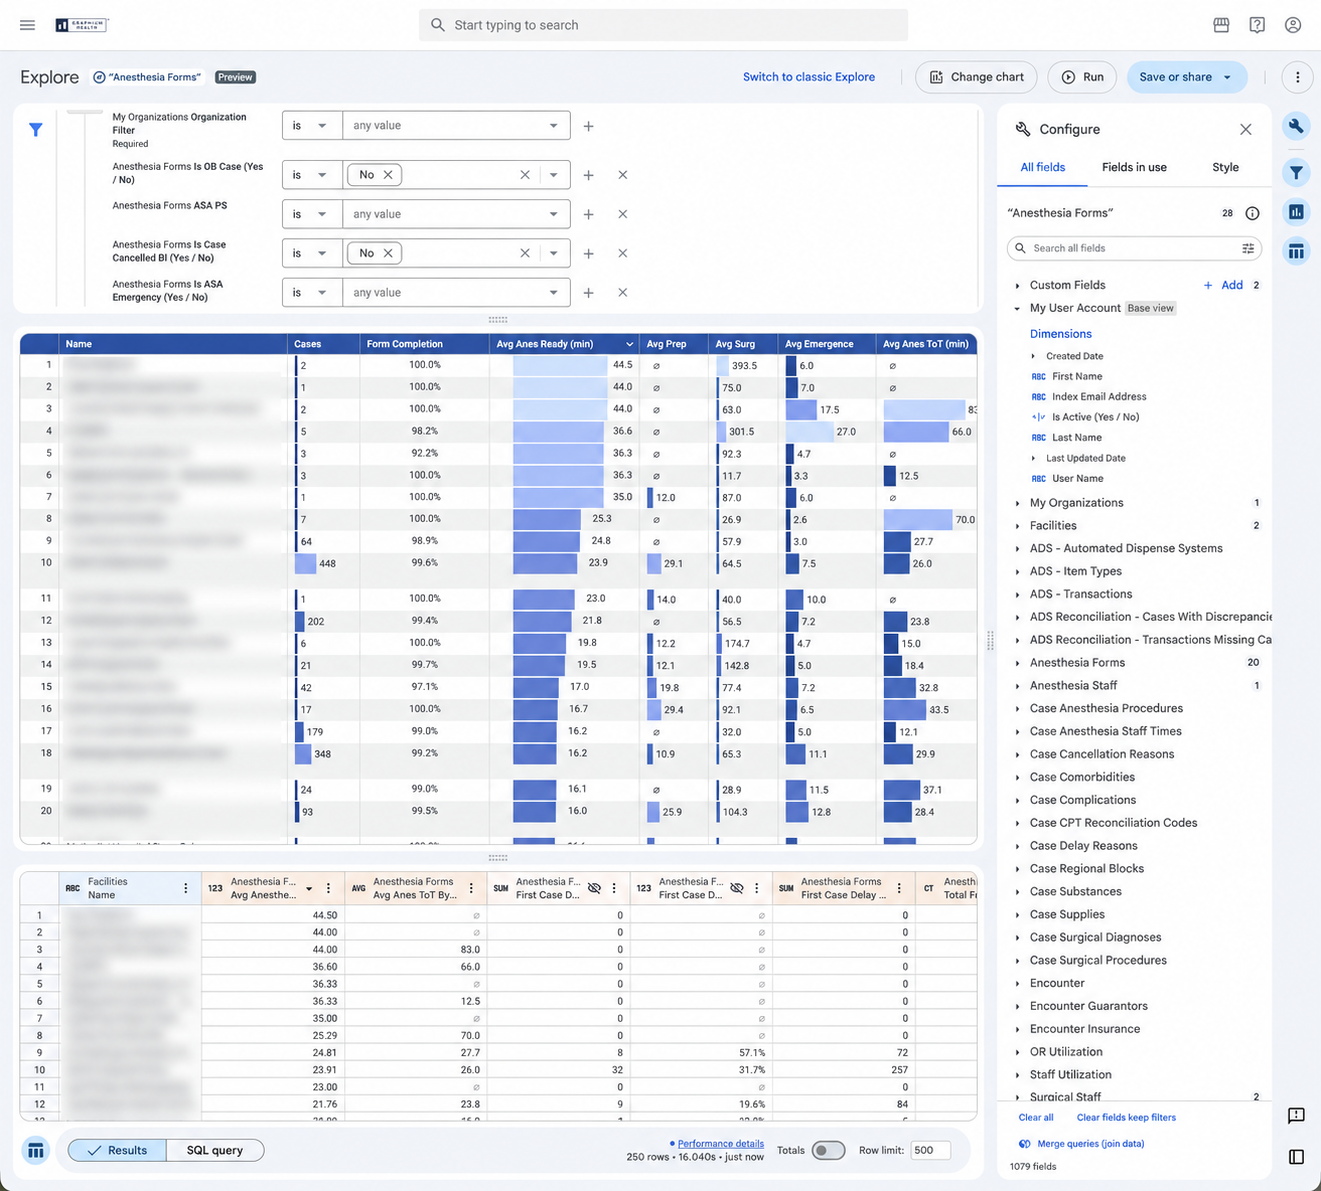
Use the fields captured on your forms to build custom charts and tables in Explore. Start with the included dashboards and create additional reports when you need them.
Reporting on your schedule.
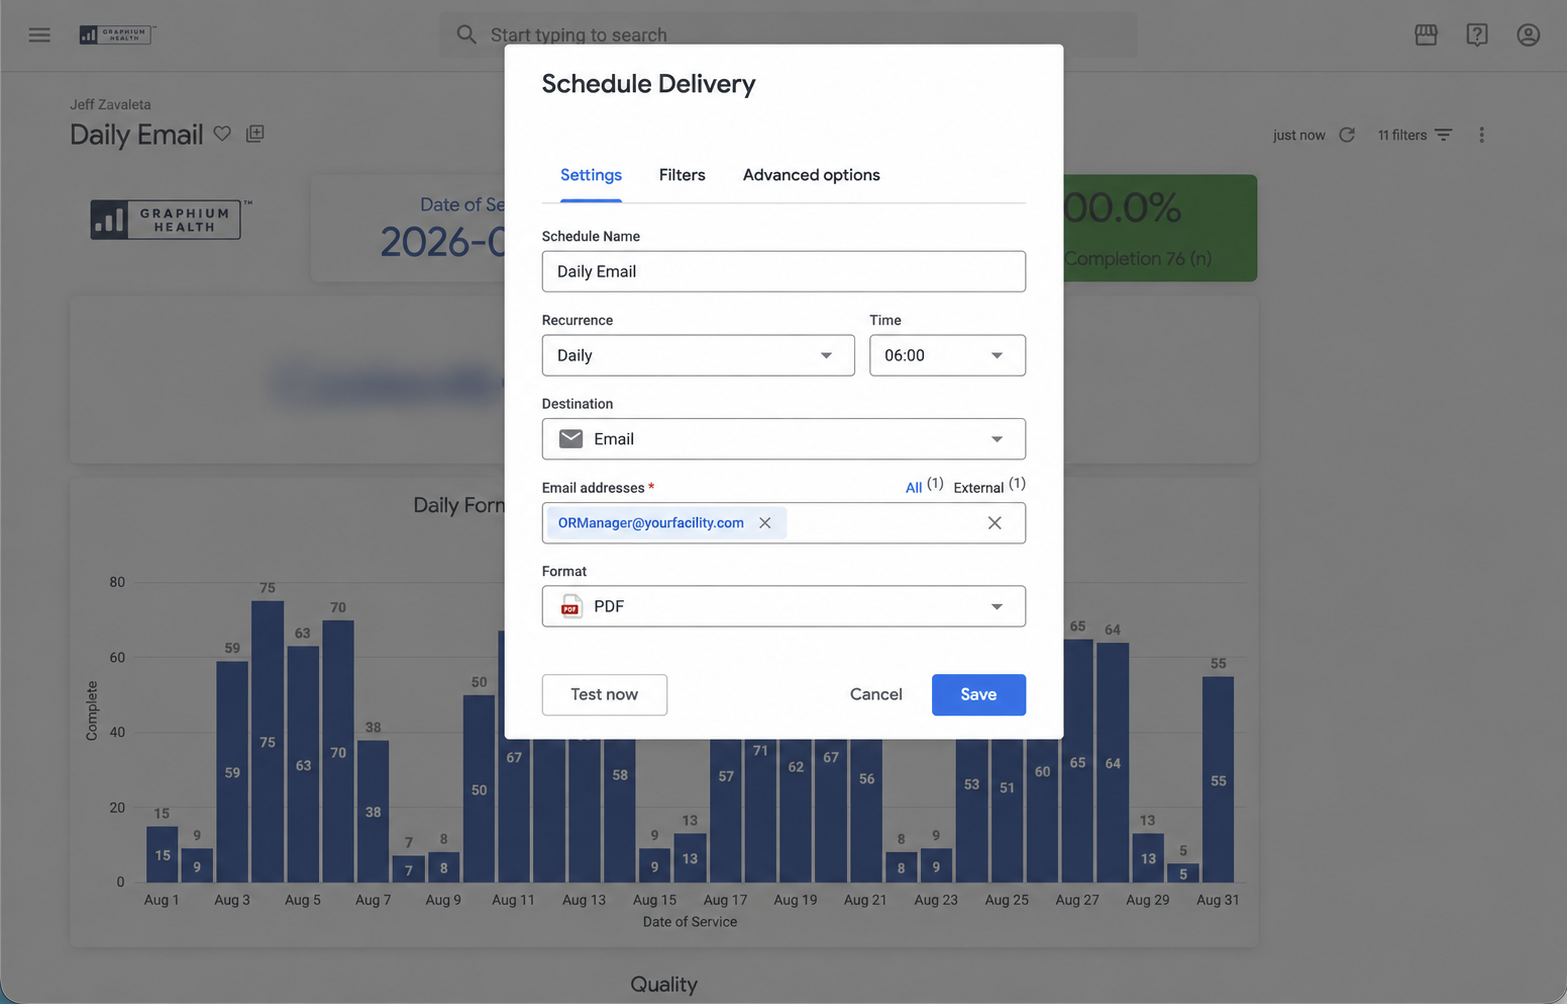
The right report finds the right person on the schedule you set.
Daily analytic emails to facility leadership with interactive drill-down links. Groups tell us this alone drives near-100% documentation compliance within weeks. Schedule reports for automatic delivery. Every report email is encrypted before it is sent. Quarterly quality reports ready for Joint Commission review, including pharmacy audits and form-completion evidence.
One data model, both halves
Clinical information and patient feedback, connected.
Graphium brings anesthesia documentation and patient satisfaction results into a shared data model. Your team can review clinical performance alongside patients’ descriptions of their care, using consistent information across reports and facilities.
The whole data set is ready for AI agent access. Explore Graphium.ai.
Useful to clinicians. Valuable to the hospital.
"I like the ease of use and how transportable it is. I've gotten rid of so many pieces of paper. It's a very good product that is reliable and satisfies all the needs of the hospital without being onerous. It solves a small hospital's needs for an EMR and gives us added value through data."