Human resources are expensive, especially highly trained, highly skilled employees such as CRNAs.
When considering salary, benefits, and recruiting costs, it becomes clear you need to accurately match staff levels with need. But knowing need is difficult, especially in the operating rooms.
Typical productivity measure systems attempt to estimate your staffing levels with the ratio of logged clinical hours:hours on the clock over a set period (i.e every 2 weeks). Unfortunately, this fails to account for daily and annual volatility. They ignore daily variations (i.e. everybody wants a 7:30 start) and the annual variation (i.e. Summer, end of the year deductibles, Spring Break, etc). The fatal assumption of “business is steady” leads to false conclusions such as, “This cost center has a productivity of 67%, they must be overstaffed.”
A Better Staffing Model
A better system in the peri-operative space would look at actual utilization throughout the day, not only cumulative productivity, per se. That is, for every 30 minute increment of the day, count the number of locations being used to know how many staff are required.
Graphium Analytics™ provided this insight at one large, tertiary referral hospital. After importing over 21,000 cases across 26 possible locations, including case start times and end times, providers, dates, and locations, Graphium Analytics™ was used to count the “max locations” used each half hour, over each day of 2011. Did the hospital really need to staff for 26 locations? If not, then how many and how often?
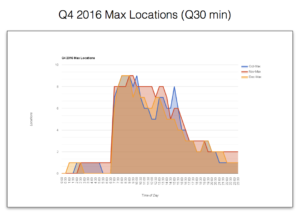
The results showed a bell curve for Max Locations vs Frequency (Figure 2). It turns out that the max number of sites ever used was 21, and that was only 2 days of the year. They only needed 20 locations 6 times a year and 19 locations 4 times a year. However, at 18 locations, the frequency jumped to 19 times a year.
In 2011, the average CRNA compensation was $169,000. Furthermore, Kaiser Family foundation estimates the average cost of family insurance premiums is $15,745 and malpractice insurance is estimated at about $6,000 per year. This totals a $190,745 cost per CRNA FTE, not including recruitment fees or retirement benefit packages.
Graphium Analytics™ allowed the administration to know they could safely reduce staffing needs from 26 locations to 21. Saving these 5 FTEs, resulted in $953,725 in annual savings. Furthermore, if they were willing to tell surgeons to wait a little longer or start a little earlier only 12 times a year, they could reduce staffing another 3 FTEs, generating a total potential savings of $1.53 million per year — in perpetuity.
Does it pay to have meaningful business intelligence? Graphium Analytics™ thinks so!